CyLab Security Academy (formerly picoCTF) Inspect HTML is a Web Exploitation Easy challenge that teaches one of the most fundamental habits in web security: looking at source code before assuming a page has nothing to offer. The flag is sitting in an HTML comment on the page — invisible in the browser, one keystroke away in DevTools.
Article Overview
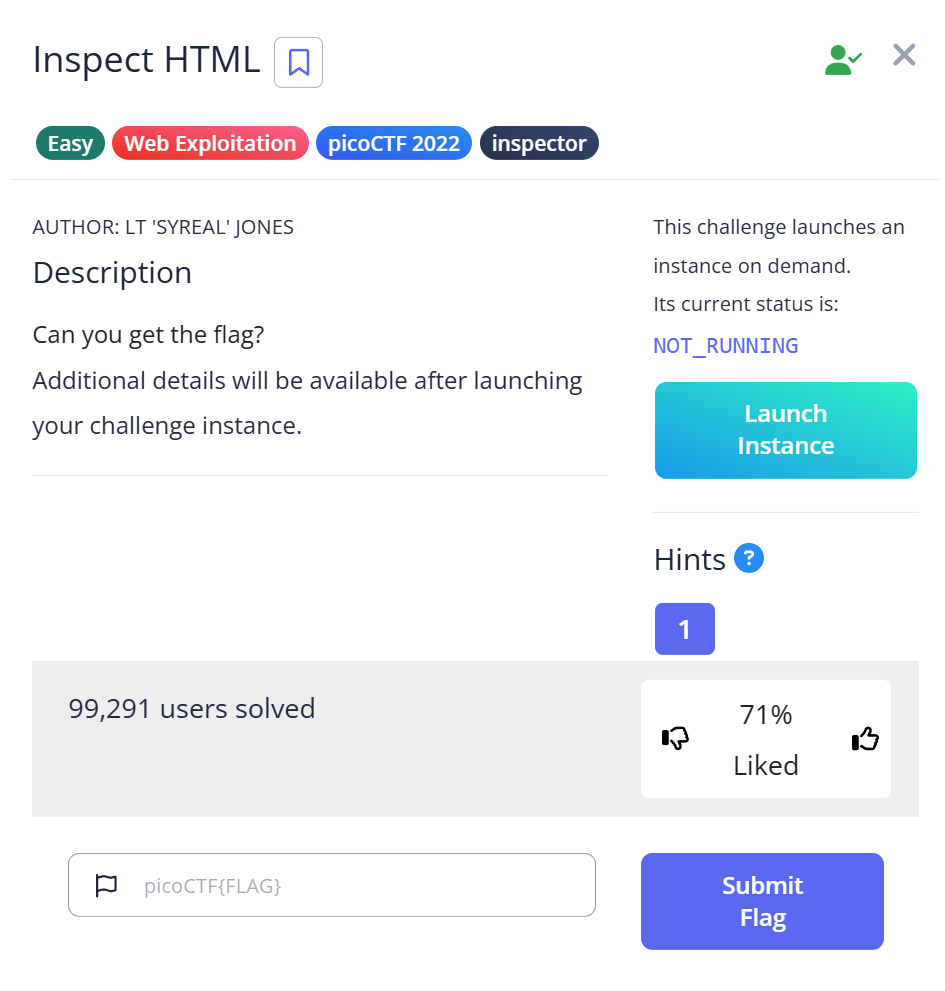
This is a writeup for Inspect HTML, a Web Exploitation Easy challenge on CyLab Security Academy (formerly picoCTF). The challenge gives you a web instance to explore. The flag is hidden in an HTML comment in the page source — not rendered by the browser, but visible immediately in Developer Tools.
In this article you’ll learn how to open and navigate browser Developer Tools, what HTML comments look like in the source, and why checking the source is the first step in any web challenge (or real-world security assessment).
Introduction
The challenge is called “Inspect HTML.” The method is in the name. But I still spent a few minutes staring at the rendered page before doing the obvious thing.
That’s actually what makes this challenge worth writing about: the gap between knowing “you should check the source” and actually doing it as a reflex. Most beginners look at a web page visually first — click around, check for forms, scan for links. The source inspection comes later, if at all. This challenge exists to rewire that instinct.
The flag name says it too: 1n5p3t0r_0f_h7ml — “inspector of HTML.” You’re being told the answer in the reward for finding the answer.
Challenge Overview
Launch the instance and you get a simple web page. Nothing visually interesting — no form, no interactive element, no hint of where the flag is. Just a rendered page that looks like it has nothing to offer.
First instinct: click around. Check if there are any links. There aren’t. The page looks static.
That’s exactly the point. The challenge wants you to look past what the browser shows you.
Step 1 — Looking in the Wrong Places First
I opened Developer Tools (F12) and went to the Network tab first — force of habit from debugging web apps. There were a few requests for the page load, nothing unusual. No hidden API call returning a flag, no suspicious XHR request. Normal traffic.
Then I checked the Console tab. Empty. No JavaScript output, no errors, nothing logged.
At this point I tried Ctrl+F on the page to search for “flag” — which searches the rendered text, not the HTML source. Unsurprisingly, nothing.
I wasted about five minutes checking places where the flag wasn’t before doing the one thing the challenge name told me to do: inspect the HTML.
Step 2 — Opening the Elements Tab and Finding the Comment
In Developer Tools, the Elements tab shows the full HTML document as the browser has parsed it. I clicked over to it and started scrolling through the markup.
Near the top of the document, between the normal HTML tags, there was a comment:
<!--picoCTF{1n5p3t0r_0f_h7ml_1fd8425b}-->That’s the flag, sitting directly in the HTML as a comment. The browser renders the page without showing it. DevTools shows everything.
Alternatively, Ctrl+U opens the raw page source in a new browser tab and Ctrl+F there searches the actual HTML — including comments. Searching for “picoCTF” in the page source would have found it in seconds.
# From the command line:
curl -s http://[challenge-host] | grep -o '<!--.*-->'
# Output: <!--picoCTF{1n5p3t0r_0f_h7ml_1fd8425b}-->
Capture the Flag
Flag: picoCTF{1n5p3t0r_0f_h7ml_1fd8425b}
Decode the leet speak: “1n5p3t0r_0f_h7ml” = “inspector of html.” The challenge named itself after the solution, and the flag named itself after the method. That level of self-reference is only funny after you’ve found it.
Full Trial Process Table
| Step | Action | Tool | Result | Why it failed / succeeded |
|---|---|---|---|---|
| 1 | Click around the page visually | Browser | Nothing found | Flag is not rendered — invisible to the eye |
| 2 | Check Network and Console tabs in DevTools | F12 → Network / Console | No unusual traffic or output | Flag is static HTML, not delivered via JavaScript or XHR |
| 3 | Ctrl+F search on rendered page | Browser find | No results | Browser search targets visible text, not HTML comments |
| 4 | Open Elements tab in DevTools | F12 → Elements | Found HTML comment with flag | Elements tab shows full parsed HTML including comments |
Short Explanations for Commands and Techniques Used
HTML Comments
HTML comments use the syntax <!-- comment -->. The browser parses them but does not render them — nothing inside a comment appears visually on the page. Developers use them for notes, disabled code, or debugging text. They are fully visible in the page source and in DevTools.
In web security, HTML comments are a common source of information leakage. Comments have been found containing API keys, internal server paths, developer credentials, and debug bypass instructions — all left in production code because “it won’t show up on the page.” The OWASP Web Security Testing Guide lists HTML comment review (OTG-INFO-005) as a standard reconnaissance step.
Note the difference from other hiding techniques: display:none (CSS) and the hidden HTML attribute make elements invisible on screen but still present in the DOM — DevTools shows them in the Elements tab with their content intact. HTML comments go one step further: they’re not DOM elements at all, just parser annotations. Both are visible in source; neither is visible to the user.
Browser Developer Tools — Elements Tab
Press F12 (or Ctrl+Shift+I) to open DevTools in most browsers. The Elements tab shows the live HTML document as the browser has parsed it. This includes elements added by JavaScript after page load, hidden elements, and HTML comments — things that Ctrl+U (view-source) may not always show in the same form.
For static pages where the flag is in the original HTML, Ctrl+U and then Ctrl+F is faster. For dynamic pages where JavaScript modifies the DOM, the Elements tab shows the current state.
curl and grep for Source Inspection
From the command line, curl -s [URL] | grep -o '<!--.*-->' extracts all single-line HTML comments. For a quick automated check across multiple pages, this is faster than opening DevTools for each one. For multi-line comments, use grep -Pzo '(?s)<!--.*?-->'.
Beginner Tips
- F12 first, always. Before doing anything else in a web challenge, open DevTools and look at the Elements tab and the Network tab. Five seconds of inspection often saves twenty minutes of searching.
- Ctrl+U opens the raw page source. Then Ctrl+F to search. This searches the actual HTML including comments — unlike the browser’s on-page search which only looks at rendered text.
- HTML comments don’t show up on the page. That’s the entire point of a comment. Don’t expect to see the flag by looking at the rendered page — look at the source.
- The challenge name is the hint. “Inspect HTML” literally tells you the method. In CTF, challenge names usually hint at the technique required — read them carefully before spending time on complex approaches.
What You Learn
The primary skill this challenge builds is source inspection as reflex. Before any active testing, before Burp Suite, before any tool — look at what the server sent. The browser renders a subset of the HTML. DevTools and view-source show everything.
In real web security testing, reviewing page source is Phase 1 reconnaissance. A quick grep for HTML comments across an entire site can surface credentials, internal paths, and developer notes that were never meant to be public. This challenge teaches that habit at its simplest: one page, one comment, one flag.
There is a related category of issue worth knowing about: JavaScript source files. Comments in external .js files are also not visible on the page but are served to the browser and readable in DevTools → Sources. I encountered exactly this in the Includes challenge — the flag was split between a CSS comment and a JavaScript comment, neither visible on the page. The technique is identical to what you learn here, applied one level deeper.
The next level from here — where the flag is split across external CSS and JavaScript files rather than sitting in the main HTML — is the Includes picoCTF challenge. Same principle, more places to look.
Further Reading
This challenge is part of the Web Exploitation series on CyLab Security Academy (formerly picoCTF). For a step up in difficulty that uses the same source inspection approach but requires finding flags across external JavaScript and CSS files, see the Includes picoCTF Writeup.
For a broader reference on web recon and the forensics tools that complement this kind of analysis, see CTF Forensics Tools: The Ultimate Guide for Beginners on alsavaudomila.com.
Leave a Reply